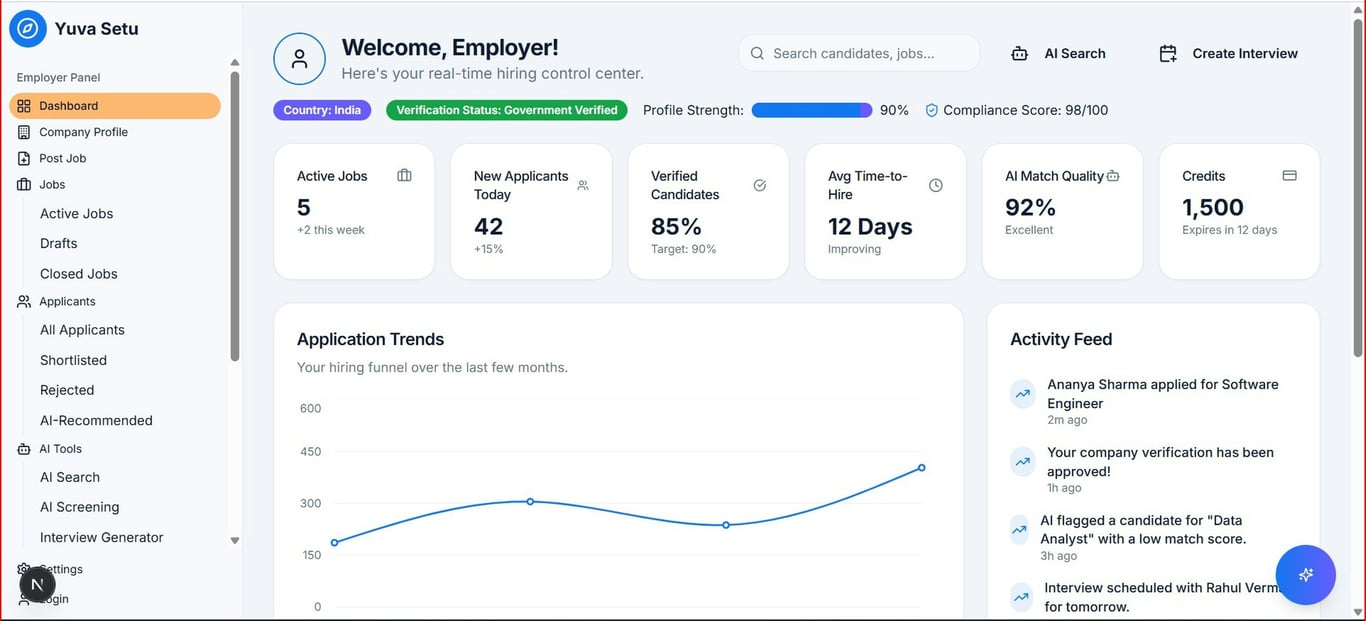
To track task and goal progress in Notion, use a Tasks database plus a related People or Projects database, then roll up completion into progress bars, rings, or charts. This Notion automation tutorial walks through the exact setup step by step.
Notion progress tracking dashboard — Photo by Stephen Dawson on Unsplash
Notion progress tracking dashboard — Photo by Stephen Dawson on Unsplash
Create a People (or Projects) database. This is where you will roll up progress. If you're tracking tasks from tools like Asana or Slack, consolidate them into Notion first.
Step 3: Link them with a Relation
In Tasks, add a Relation property to People (or Projects).
If each task has one owner, set the relation limit to 1.
If tasks can be shared, allow multiple.
Step 4: Add a rollup that calculates % complete
In People, add a Rollup property:
Relation: the relation to Tasks
Property: Status
Calculate: Percent per group (choose the group that represents completion)
Then format the rollup to display as:
Bar for an inline progress bar, or
Ring for a compact dashboard view.
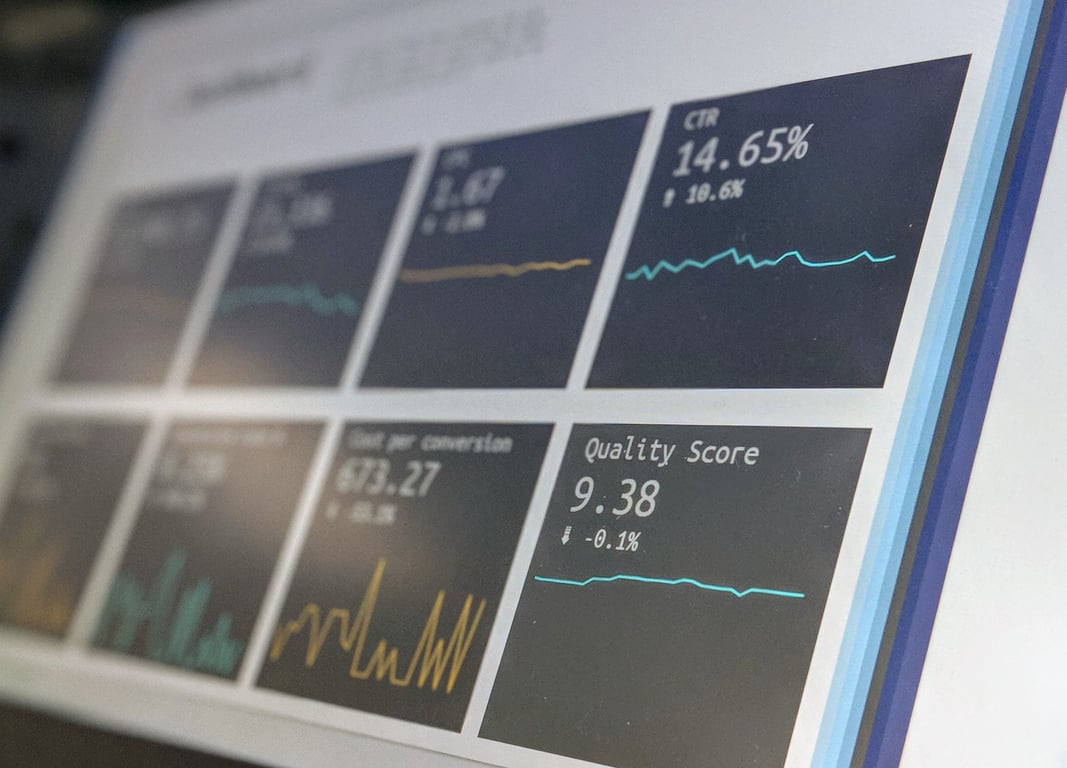
Step 5: Visualize company goals with charts
For simple goal tracking (for example, monthly revenue vs an annual goal), create a database like Monthly Metrics:
Month (Date)
Revenue (Number formatted as currency)
Then add a Chart view:
Chart type: Line
X-axis: Month
Y-axis: Revenue
This gives you a quick trend line without leaving Notion.
Example: a simple company dashboard layout
On a Dashboard page, add:
A Tasks board (grouped by Status)
A People table that shows the progress ring per person
A Monthly Metrics chart view
Common mistakes to avoid
Rolling up the wrong property. For percent complete, roll up a checkbox or status.
Missing a consistent “Done” status. Make sure your team uses the same completion definition.
Over-complicating the first version. Start with 5 properties, not 25.
Need help building this?
If you want help designing a clean Notion progress tracking system for your team, book a free discovery call. We'll map out the right database structure for your workflows and get your dashboard built the right way — without over-engineering it.
Learn what AI coworkers are and how to build role-based agents in Notion with least-privilege permissions, cost guardrails, explicit triggers, and review.