How a Homeless Services Nonprofit Replaced a Broken Dashboard Stack with Real-Time Financial Reporting
How a ~60-person homeless services nonprofit replaced broken Klipfolio dashboards with real-time QuickBooks P&L reports in Looker Studio — built in 3 sessions.
A ~60-person homeless services nonprofit had years of Klipfolio dashboards that stopped pulling data correctly. A Connex consultant connected QuickBooks to Looker Studio via Coupler.io in three sessions — leadership now sees real-time P&L on TV dashboards across the office, with $1.9M (current year) and $2.2M (prior year) financials confirming the data is live and accurate.
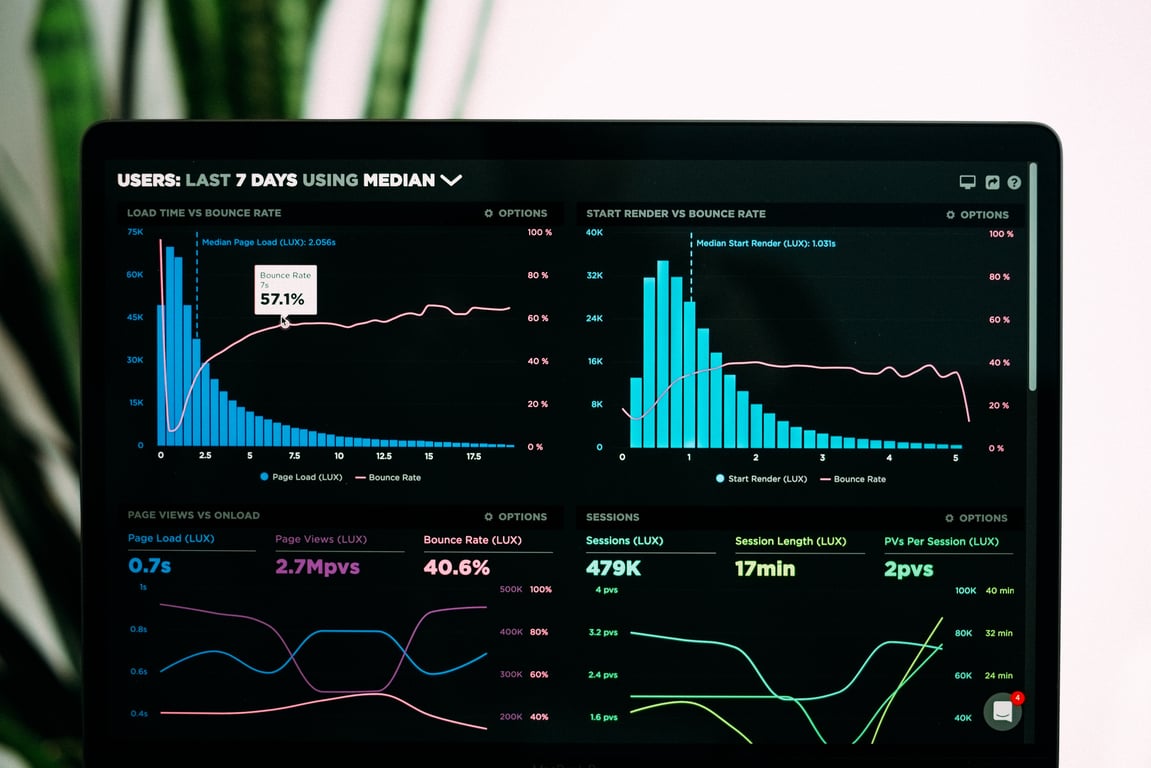
Photo by Stephen Dawson on Unsplash
The Situation
A ~60-person nonprofit focused on homeless services operates an AI-driven case management system that evaluates 100+ data points to help individuals find stable housing. Last year alone, the organization placed over 1,400 people off the streets and launched a Tiny Home Community for elderly and disabled residents. The mission generates real data — and leadership needs to see it clearly.
Their reporting stack was built over several years: a mix of Klipfolio dashboards, a CRM data source, a JSON feed on a web server, Google Sheets, and QuickBooks. The dashboards were displayed on TV screens around the office — a digital signage setup meant to keep the team aligned on financial and operational performance.
The Problem
"We trust the data — but the data sources aren't working, aren't connected." The Klipfolio dashboards had become a patchwork that no longer held together. Data wasn't flowing in reliably from QuickBooks or other sources. Klips broke silently. Leadership couldn't tell whether the numbers on the screen were current or stale from two weeks ago.
The organization had also outgrown Klipfolio's pricing model. As their data sources and dashboard needs expanded, the subscription cost climbed without a proportional improvement in reliability. They wanted to move everything to Looker Studio — better scalability, no ongoing subscription cost for the dashboarding layer itself — but needed help building the connectors and replicating the existing views.
What They'd Already Tried
They had used Bolt with APIs to pull some data directly and had manually built Klipfolio Klips against JSON feeds. They'd also been working with Connex since 2021 on the original Klipfolio setup and Zapier automations, and a previous consultant had gotten partway into the Klipfolio custom connection before the work stalled. What was missing was a reliable, maintained connector between QuickBooks and Looker Studio that could handle P&L class filtering.
What Was Built
Across three working sessions, a Connex consultant scoped the connector options, chose Coupler.io over Supermetrics for better QuickBooks connectivity, authenticated it to the client's QuickBooks account, and built the pipeline into Looker Studio.
Two P&L data sources in Coupler.io: "This Year to Date" and "Last Year to Date" — both verified live against QuickBooks actuals.
A Live P&L report in Looker Studio pulling both sources, with class-based filtering to match the organization's QuickBooks chart of accounts.
A year-to-date performance dashboard extending the P&L, built to match the design of the original Klipfolio screens.
The output feeds Amazon signage sticks on TV screens — the same delivery format as before, now running fresh data instead of stale Klips.
When a QuickBooks data-pull blocker surfaced mid-build, the consultant identified it explicitly so the team could address the underlying account configuration — rather than patching around it and leaving a fragile dependency.
The Results
The Live P&L report verified $1.9M in current-year income and $2.2M in prior-year income — confirming the data connection was accurate and the dashboard was reading live financials. (Figures are real, drawn directly from the client's QuickBooks data during the build.)
Leadership now has financial reporting dashboard visibility they can trust — not screens that might be showing two-week-old numbers. The Looker Studio layer requires no per-seat subscription, and the Coupler.io connector refreshes on a schedule, so the data stays current without manual intervention.
The organization also confirmed interest in extending the same approach to replicate a complex Notion database setup for other departments — the reporting foundation is now in place to build on.
FAQ
Can Looker Studio actually replace Klipfolio for digital signage?
Yes — and in most cases it's more reliable. Looker Studio reports display in any browser and work well with Amazon signage sticks and similar players. The reporting layer itself is free; you pay for connectors (like Coupler.io) where needed, and those tend to be far cheaper than full Klipfolio plans once your dashboard count grows.
Why Coupler.io over Supermetrics or native Looker connectors?
Coupler.io offered better QuickBooks connectivity options for this use case — specifically the ability to pull P&L class-filtered reports that matched how the organization structured its chart of accounts. Native Looker Studio doesn't have a maintained QuickBooks connector, and Supermetrics' QuickBooks support was a weaker fit for P&L data at this depth.
How long did the migration take?
Three one-hour sessions across one week: connector selection and QuickBooks authentication in session one, the Live P&L report and verified data in session two, and the year-to-date dashboard extension in session three. The client did not need to attend every session — they received a recording link, a summary of what was accomplished, and next steps after each hour.
What happens when QuickBooks data changes?
Coupler.io runs on a refresh schedule, so the Looker Studio report pulls updated QuickBooks data automatically. No manual export, no copy-paste into sheets. If a data pull fails, Coupler.io surfaces the error — you know immediately rather than discovering stale data a week later.
Ready to untangle your data stack?
If your dashboards have stopped pulling reliable data — or you're paying for a reporting tool that's outgrown its usefulness — we can scope the migration in a single session. Book a call here.
A NYC performing arts nonprofit was running its operation across 10+ disconnected tools. Here's how they automated proposals, invoicing, and client intake.